Overview
Continuous subdomain monitoring helps security teams discover shadow IT, track infrastructure changes, and identify attack surface expansion in real-time. This tutorial shows you how to configure automated daily scans, set up alerts, and integrate findings with your security workflow.
What You'll Learn
- Configure daily reconnaissance scans
- Set up Slack/Teams alerts for new findings
- Integrate with vulnerability scanners
- Track attack surface changes over time
- Export findings to CSV/JSON
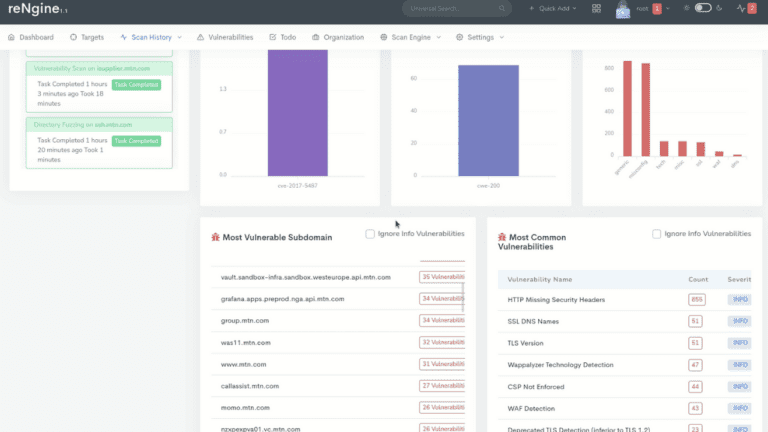
reNgine Scan History - Track Changes Over Time
Step 1: Configure Daily Reconnaissance Scans
Set up a scheduled scan to run daily at a time that minimizes impact on production systems. We recommend running scans during off-peak hours (e.g., 2:00 AM local time).
POST /api/scans/scheduled
{
  "target_domain": "example.com",
  "scan_engine": "full_scan",
  "schedule": {
    "frequency": "daily",
    "time": "02:00",
    "timezone": "UTC"
  },
  "notification_enabled": true
}
Step 2: Set Up Slack/Teams Alerts for New Findings
Configure webhook notifications to receive instant alerts when new subdomains are discovered. This enables rapid response to shadow IT and unauthorized infrastructure.
Slack Webhook Configuration
POST /api/notifications/webhooks
{
  "name": "Security Team Alerts",
  "type": "slack",
  "webhook_url": "https://hooks.slack.com/services/YOUR/WEBHOOK/URL",
  "events": [
    "new_subdomain_discovered",
    "critical_vulnerability_found",
    "scan_completed"
  ],
  "filters": {
    "severity": ["critical", "high"]
  }
}
Step 3: Integrate with Vulnerability Scanners
Automatically trigger vulnerability scans on newly discovered subdomains to identify security issues immediately. Connect reNgine with tools like Nessus, Qualys, or Nuclei.
- Nuclei Integration: Run 4,000+ vulnerability templates automatically
- Custom Scripts: Execute custom security checks via webhooks
- API Export: Send findings to external SIEM or ticketing systems
- Severity Filtering: Focus on critical and high-severity findings
POST /api/integrations/vulnerability-scanners
{
  "scanner": "nuclei",
  "trigger_on": "new_subdomain",
  "severity_threshold": "medium",
  "templates": [
    "cves",
    "exposures",
    "misconfigurations"
  ]
}
Step 4: Track Attack Surface Changes Over Time
Use historical data to identify trends in subdomain discovery and infrastructure changes. Track metrics like:
Key Metrics to Monitor
| Metric | Description | Alert Threshold |
|---|---|---|
| New Subdomains | Count of newly discovered assets | >5 per day |
| Port Changes | New open ports on existing hosts | Any change |
| Certificate Expiry | SSL/TLS certificates nearing expiration | <30 days |
| Technology Stack | Changes in detected technologies | New frameworks |
Step 5: Export Findings to CSV/JSON
Export scan results for reporting, compliance, or integration with external tools. Use the API to automate exports on a schedule.
GET /api/scans/123/export?format=json
GET /api/scans/123/export?format=csv
GET /api/analytics/trends?period=30days&format=pdf
Best Practices
- Baseline First: Run an initial full scan to establish your current attack surface
- Tune Alerts: Adjust notification thresholds to reduce alert fatigue
- Regular Reviews: Weekly review of new findings with security team
- Documentation: Maintain inventory of authorized vs. shadow IT assets
- Remediation SLA: Define response times for different severity levels
Next Steps
- Deploy reNgine Cloud on AWS or Azure
- Explore advanced scanning features in our documentation
- Learn about AI-powered vulnerability analysis
- Get support from our team via contact page