Run Your First Reconnaissance Scan
Configure and execute your first automated reconnaissance scan with reNgine Cloud.
Overview
This tutorial walks you through creating your first reconnaissance scan in reNgine Cloud. You'll learn how to add targets, configure scan profiles, execute scans, interpret results, and export findings for further analysis or reporting.
Prerequisites
- reNgine Cloud instance deployed (see AWS or Azure deployment tutorials)
- Admin access to reNgine dashboard
- Target domain or IP address to scan (you must have permission to scan)
- Basic understanding of reconnaissance concepts
What You'll Learn
- Add and manage target domains
- Configure scan profiles and engines
- Initiate and monitor reconnaissance scans
- Interpret scan results and findings
- Export data in multiple formats
- Schedule automated recurring scans
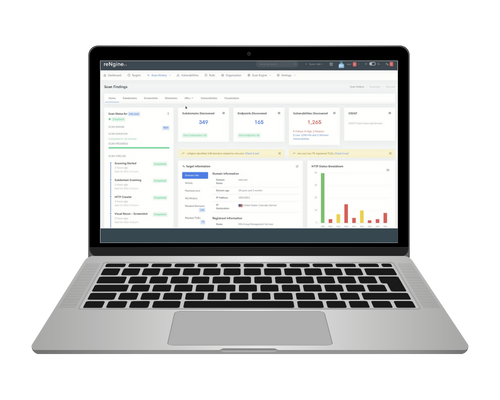
reNgine Dashboard - Reconnaissance Overview
Legal Notice: Only scan domains and infrastructure you own or have explicit written permission to test. Unauthorized scanning may violate laws and terms of service. Always obtain proper authorization before conducting reconnaissance.

Reconnaissance Pipeline — The scanning phases you'll configure in this tutorial
Step 1: Add a Target Domain
Begin by adding your target domain to reNgine. This creates a project that will contain all scan data, findings, and historical results.
Via Dashboard
- Log into reNgine dashboard
- Navigate to "Targets" in the left sidebar
- Click "Add Target" button
- Enter your domain name (e.g., example.com)
- Add optional description and tags
- Click "Save" to create the target
POST /api/targets/
Authorization: Bearer YOUR_API_KEY
Content-Type: application/json

{
  "name": "example.com",
  "description": "Company website - Q1 2025 assessment",
  "h1_team_handle": "@security-team",
  "tags": ["production", "web-app"]
}
Step 2: Understand Scan Profiles
Scan profiles define what tools run and how aggressive the scan will be. reNgine includes several pre-configured profiles for different use cases.
Built-in Scan Profiles
| Profile | Scope | Duration |
|---|---|---|
| Quick Scan | Subdomain enum, basic port scan | 5-10 minutes |
| Full Scan | Complete enumeration, vulnerability scan | 30-60 minutes |
| OSINT Only | Passive information gathering | 10-15 minutes |
| Screenshot | Web screenshots only | 15-20 minutes |
| Custom Profile | Your custom tool configuration | Varies |
Step 3: Configure Scan Engine
Scan engines are collections of reconnaissance tools. You can customize which tools run and their parameters.
Common Reconnaissance Tools
| Tool | Purpose | Output |
|---|---|---|
| subfinder | Subdomain discovery | List of subdomains |
| httpx | HTTP probing | Active web services |
| nuclei | Vulnerability scanning | CVEs and misconfigurations |
| naabu | Port scanning | Open ports and services |
| gau | URL discovery | Historical URLs |
| dalfox | XSS scanning | XSS vulnerabilities |
# Example: Custom scan engine configuration
{
  "engine_name": "Custom Full Recon",
  "subdomain_discovery": true,
  "http_probe": true,
  "port_scan": true,
  "vulnerability_scan": true,
  "screenshot": true,
  "nuclei_severity": ["critical", "high", "medium"],
  "port_scan_type": "top-1000",
  "enable_http_crawl": true,
  "enable_osint": true
}
Step 4: Launch Your First Scan
Now you're ready to initiate your first reconnaissance scan.
Via Dashboard
- Navigate to your target domain
- Click "Start Scan" button
- Select scan engine (e.g., "Full Scan")
- Choose whether to import subdomains from external sources
- Click "Start Scan" to begin
- Monitor progress in real-time on the scan dashboard
POST /api/scans/
Authorization: Bearer YOUR_API_KEY

{
  "target_id": 1,
  "scan_engine_id": 2,
  "scan_type": "full",
  "import_subdomains": true
}

# Response
{
  "id": 42,
  "status": "running",
  "target": "example.com",
  "scan_engine": "Full Scan",
  "started_at": "2025-01-15T10:00:00Z",
  "celery_ids": ["abc-123", "def-456"]
}
Scan progress is displayed in real-time. You'll see each tool's status as it executes.
Step 5: Monitor Scan Progress
Track your scan in real-time from the dashboard. reNgine provides detailed metrics on each task.
Scan Stages
- Subdomain Discovery: Finding all subdomains (subfinder, amass)
- HTTP Probing: Identifying active web services (httpx)
- Port Scanning: Discovering open ports (naabu)
- Service Detection: Fingerprinting services (nmap, wappalyzer)
- Vulnerability Scanning: Finding security issues (nuclei)
- Screenshot Capture: Taking website screenshots (gowitness)
- Report Generation: Compiling results
# Check scan status via API
GET /api/scans/42/
Authorization: Bearer YOUR_API_KEY

# Response includes task progress
{
  "id": 42,
  "status": "running",
  "progress": {
    "subdomain_discovery": "completed",
    "http_probe": "running",
    "port_scan": "pending",
    "vulnerability_scan": "pending"
  },
  "subdomains_found": 127,
  "endpoints_discovered": 89,
  "vulnerabilities_found": 12
}
Step 6: Analyze Scan Results
Once the scan completes, review your findings across multiple categories.
Result Categories
| Category | Information |
|---|---|
| Subdomains | All discovered subdomains with IP addresses and HTTP status |
| Endpoints | Active URLs, parameters, and technologies |
| Vulnerabilities | Security findings categorized by severity |
| Technologies | Detected frameworks, CMS, servers, libraries |
| Screenshots | Visual captures of web interfaces |
| DNS Records | A, AAAA, CNAME, MX, TXT records |
| Directories | Discovered paths and directories |
# Get scan results summary
GET /api/scans/42/results/
Authorization: Bearer YOUR_API_KEY

# Response structure
{
  "scan_id": 42,
  "target": "example.com",
  "summary": {
    "subdomains": 127,
    "endpoints": 89,
    "vulnerabilities": {
      "critical": 2,
      "high": 8,
      "medium": 15,
      "low": 23,
      "info": 45
    },
    "technologies": 34,
    "interesting_subdomains": 12
  },
  "completion_time": "2025-01-15T11:30:00Z",
  "duration_minutes": 90
}
Step 7: Export Results
Export scan data in various formats for reporting or further analysis.
Export Formats
- PDF Report: Executive summary with key findings
- JSON: Complete structured data for automation
- CSV: Spreadsheet-friendly format
- HTML: Interactive web report
- Markdown: Documentation-ready format
# Export scan results
GET /api/scans/42/export?format=pdf
GET /api/scans/42/export?format=json
GET /api/scans/42/export?format=csv

# Or via dashboard: Click "Export" → Select format → Download
Step 8: Schedule Automated Scans
Set up recurring scans to continuously monitor your attack surface.
POST /api/scheduled-scans/
Authorization: Bearer YOUR_API_KEY

{
  "target_id": 1,
  "scan_engine_id": 2,
  "frequency": "weekly",
  "day_of_week": "monday",
  "time": "02:00",
  "timezone": "UTC",
  "enabled": true,
  "notification_emails": ["security@company.com"]
}
Scheduling Options
- Daily: Run scans every day at specified time
- Weekly: Run on specific day of week
- Monthly: Run on specific day of month
- Custom Cron: Advanced scheduling with cron expressions
Understanding Results: Example Findings
Here's what a typical scan might discover:
Sample Scan Results for example.com
# Subdomains (127 found)
www.example.com         → 93.184.216.34
api.example.com         → 93.184.216.35
admin.example.com       → 93.184.216.36
staging.example.com     → 93.184.216.37
dev.example.com         → 93.184.216.38

# Critical Vulnerabilities (2)
[CRITICAL] SQL Injection on api.example.com/search?q=
[CRITICAL] Exposed .git directory on staging.example.com/.git/

# High Vulnerabilities (8)
[HIGH] Missing security headers on www.example.com
[HIGH] Outdated WordPress version on blog.example.com
[HIGH] Exposed admin panel on admin.example.com (no auth)
...

# Technologies Detected
- WordPress 5.8 (outdated)
- PHP 7.4
- nginx 1.18.0
- MySQL
- jQuery 3.5.1
- Cloudflare CDN
Best Practices
Scanning Tips
- Start with OSINT-only scans for passive reconnaissance
- Run scans during off-peak hours to minimize impact
- Review and triage findings immediately after scans complete
- Track remediation progress by comparing scan results over time
- Use tags to organize targets by environment (prod, staging, dev)
- Configure notifications for critical findings
- Regularly update scan engines to get latest vulnerability checks
- Document scope and authorization before scanning
Troubleshooting
Common Issues
Scan Stuck or Not Starting:
- Check Celery worker status:
docker-compose logs celery - Verify Redis connection is active
- Ensure sufficient disk space is available
- Check if previous scans are consuming all workers
No Subdomains Found:
- Verify target domain is correct and resolvable
- Check internet connectivity from reNgine instance
- Some domains may have minimal subdomain footprint
- Review subfinder configuration and API keys
Scan Taking Too Long:
- Large domains can take several hours to scan completely
- Reduce scope by using Quick Scan profile first
- Check if vulnerability scanning is the bottleneck
- Consider increasing EC2/VM instance size for more resources
Next Steps
Configure AI Analysis
Enable GPT-powered vulnerability analysis and automated report generation.
View Tutorial →GPU Setup for Local LLM
Configure local GPU-accelerated LLMs using Ollama for offline AI analysis.
View Tutorial →Get the Free reNgine Cloud Getting Started Guide
A 7-part email series covering everything from your first deployment to advanced configuration and real-world workflows. One email per day, no spam.