How to Build a 12-Month Phishing Simulation Program with HailBytes SAT
January 15, 2026 • 11 min read

Watch: Phishing Simulation Maturity - Building a Measurement Framework (6 min)
Most phishing simulation programs start the same way: someone runs a campaign, reports a click rate, and then nobody knows what to do next. Six months later, someone runs another campaign and gets a similar click rate. The organization has learned nothing, changed nothing, and spent money on a checkbox exercise.
A structured 12-month program changes the outcome. Each month has a specific objective, a progression in difficulty, and a measurable goal. By month 12, you’ve built the data to justify continued investment, identified your highest-risk employee populations, and demonstrated measurable improvement to leadership. Here’s the blueprint.

Phishing Program Maturity - Quarterly Progression from Baseline to Continuous Improvement
A 12-month program lives in HailBytes SAT's Campaigns view - active this month, archived history for year-over-year reporting.
Months 1–3: Baseline and Foundation
Month 1 - Baseline Measurement. Send a moderate-difficulty phishing simulation to your entire organization. Use a credential-harvesting template that mimics a common scenario: password expiration notice, shared document notification, or IT support request. Do not warn employees in advance. The goal is an honest baseline click rate. Industry averages for untrained organizations range from 25–35%. Record the click rate, credential submission rate, and time-to-click distribution by department. This is your “before” snapshot.
Month 2 - Security Awareness Communication. Share the baseline results (anonymized) with the organization. Announce the phishing simulation program and its purpose: measuring and improving the organization’s ability to recognize social engineering. Distribute a brief training resource - a one-page guide on identifying phishing indicators (sender address mismatches, urgency language, suspicious URLs). This is the only “training” intervention before the next test.
Month 3 - Post-Training Measurement. Send the same difficulty level as month 1, but with a different template theme. Compare click rates. A well-received training communication typically produces a 10–20% reduction in click rates. If the reduction is smaller, the training resource didn’t land - revisit the format. If the click rate is roughly the same, the training was ignored - consider making it mandatory with acknowledgment tracking.
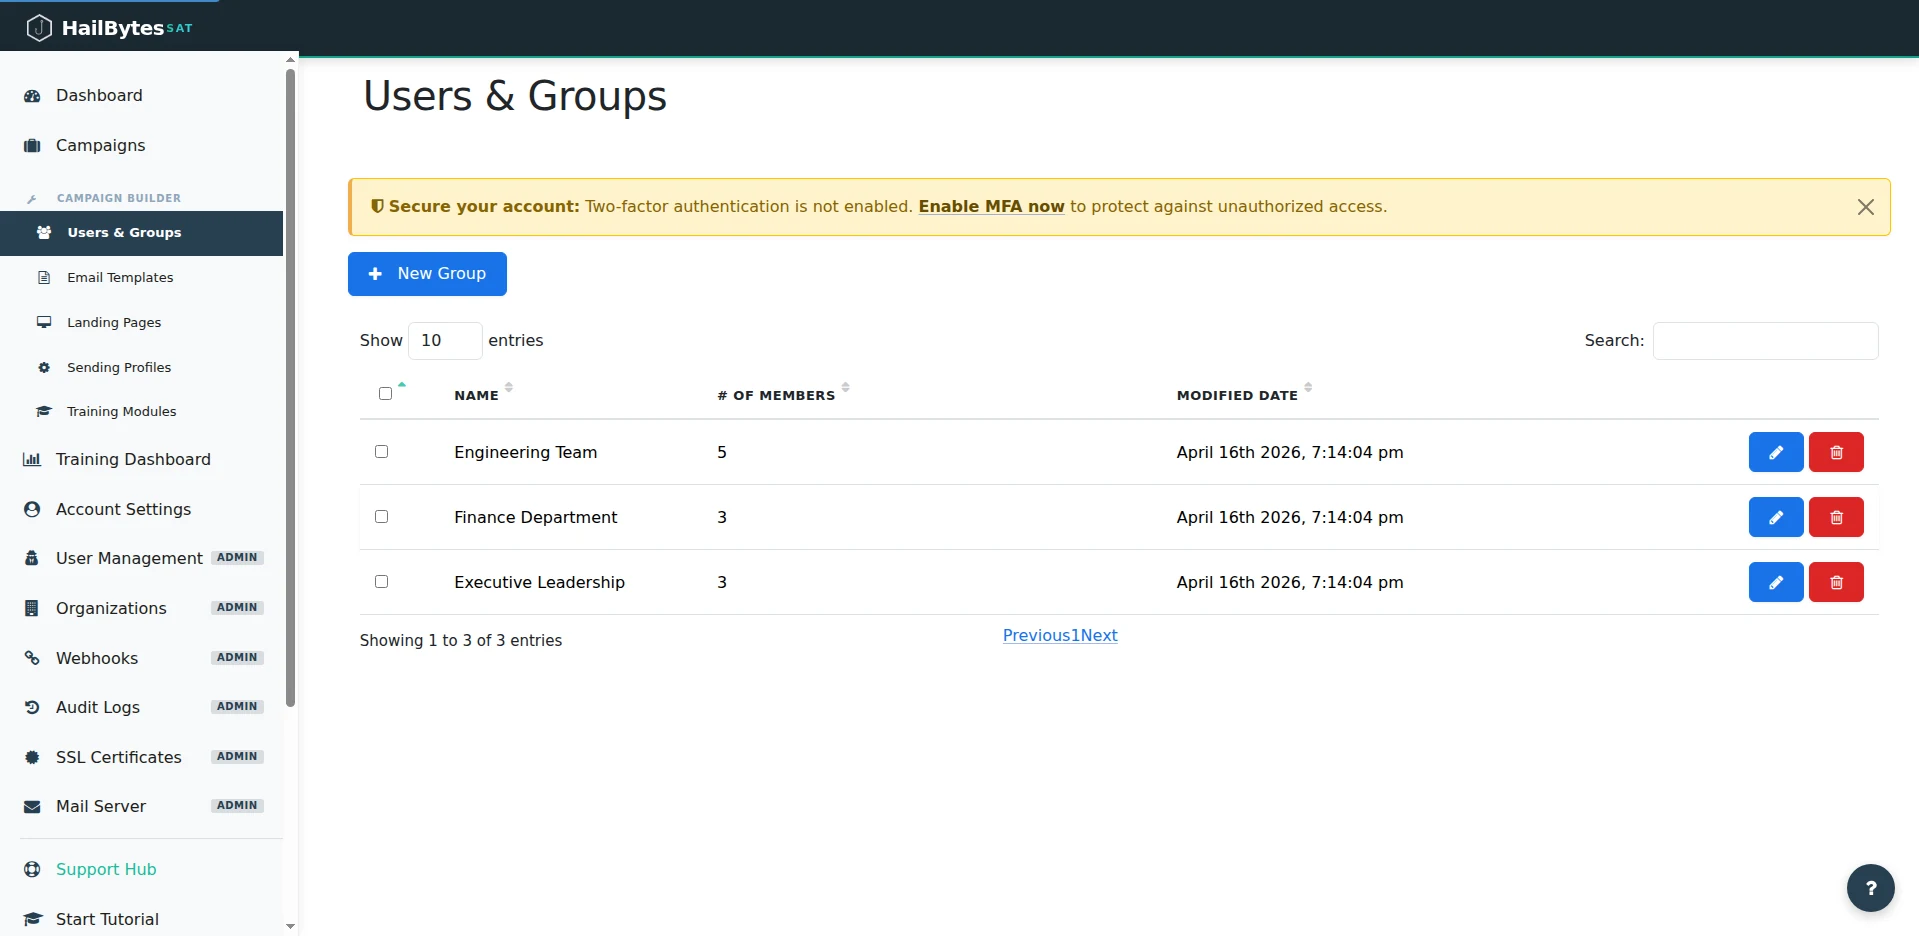
Department-level groups make month 4's segmentation a one-click selection during campaign creation.
Months 4–6: Segmentation and Escalation
Month 4 - Department-Level Targeting. Run separate campaigns for each major department. Finance gets a vendor invoice template. HR gets a benefits enrollment template. Engineering gets a code review request template. Department-specific scenarios test whether employees recognize social engineering in context - the kind of phishing that actually targets them. Measure click rates by department. You will find significant variation. Some departments (typically finance and executive assistants) click at 2–3x the organizational average.
Month 5 - Difficulty Escalation. Introduce more sophisticated techniques: display name spoofing with a trusted internal sender, a template that includes a real company project name (sourced from public information), or a notification from a real vendor the company uses. Click rates will increase. That’s the point - you’re measuring resilience against realistic attacks, not trivial ones. Document the click rate increase so leadership understands that the difficulty increased, not that training failed.
Month 6 - Executive Reporting Milestone. Compile the first half-year report. Include: baseline click rate (month 1), post-training click rate (month 3), department-level breakdown (month 4), and advanced scenario performance (month 5). Present the trendline, not individual data points. The narrative should be: “We established a 28% baseline, reduced to 19% with basic training, identified finance as our highest-risk department, and are now testing against more sophisticated scenarios.” Request continued program funding based on demonstrated progress.
Months 7–9: Advanced Scenarios and Repeat Offenders
Month 7 - Repeat Offender Intervention. By now, you have six months of data showing which individuals have clicked on multiple campaigns. These repeat offenders represent disproportionate organizational risk. Create a targeted intervention: a 15-minute one-on-one session with their manager and a security team member, focused on the specific templates they clicked and why. This is not punitive - it’s a coaching session. Track whether their behavior changes in subsequent campaigns.
Month 8 - Multi-Vector Simulation. Combine a phishing email with a secondary channel: a follow-up phone call (“Hi, this is IT support, did you receive an email about updating your credentials?”) or a text message. Multi-vector attacks are how real breaches happen. The click rate on multi-vector simulations is typically 40–60% higher than email-only. This data point is critical for justifying investment in broader security awareness - not just email training.
Month 9 - Reporting and Recognition. Identify departments and individuals who have shown the most improvement. Public recognition (without identifying who clicked) reinforces the desired behavior. Publish a “security awareness leaderboard” showing department-level improvement percentages. Competition between departments is one of the most effective behavior-change mechanisms available.
Months 10–12: Maturity and Measurement
Month 10 - Report Rate Measurement. Shift the primary metric from click rate to report rate: the percentage of employees who use the phishing report button (or forward to the security team) rather than clicking, ignoring, or deleting the email. A mature program has a report rate of 60%+ and a click rate under 10%. Configure HailBytes SAT to track which recipients forwarded or reported the simulation email, giving you this metric alongside the traditional click data.
Month 11 - Red Team Scenario. Run a single, highly targeted spear-phishing campaign against a small group (C-suite, IT admins, or employees with elevated access). Use OSINT to personalize the emails - reference real projects, real colleagues, real events. This is the hardest test. Even well-trained employees click at 15–25% on well-researched spear phishing. The result demonstrates the ceiling of training-based controls and supports the case for technical controls (email authentication, URL sandboxing) alongside the awareness program.
Month 12 - Annual Report and Program Renewal. Compile the full-year dataset: 12 monthly simulations, department breakdowns, repeat offender trends, difficulty escalation results, and the report rate maturity metric. Present the year-over-year comparison (if this is year two or later) or the month-1-to-month-12 improvement curve. Include the cost per employee of the program versus the cost of a single phishing-related incident. This report justifies Year 2 funding and becomes a compliance artifact for SOC 2, PCI-DSS, and ISO 27001 audits.
Start Month 1 Today
HailBytes SAT gives you the platform to run this entire 12-month program. Launch your baseline campaign this week and start building the data that demonstrates real security improvement.